When Enough is Enough with your A/B Test
A good A/B test tool should be able to reach the following conclusions:
- A beat B or B beat A, so you can stop.
- Neither A nor B beat the other, so you can stop.
- We can’t conclude #1 or #2 but you’ll need about m more data points to conclude one of them.
The tools I’ve found for analyzing A/B tests can all answer #1. Some of the better ones can answer #3. None of the tools I’ve seen will answer #2 and tell you that A and B are not meaningfully different and that you have enough data to be pretty sure about that.
This has to do with the way most people use hypothesis testing. Stats students are taught to test the simple hypothesis “Is the amount B improves over A positive?” They get a p-value (related to the notion of the effect actually being negative) and go from there. The problem is that the probability that the effect is precisely zero is zero.
Here’s a fix for that: Choose a minimum meaningful effect and test the hypothesis that the absolute value of the effect is smaller than that value.
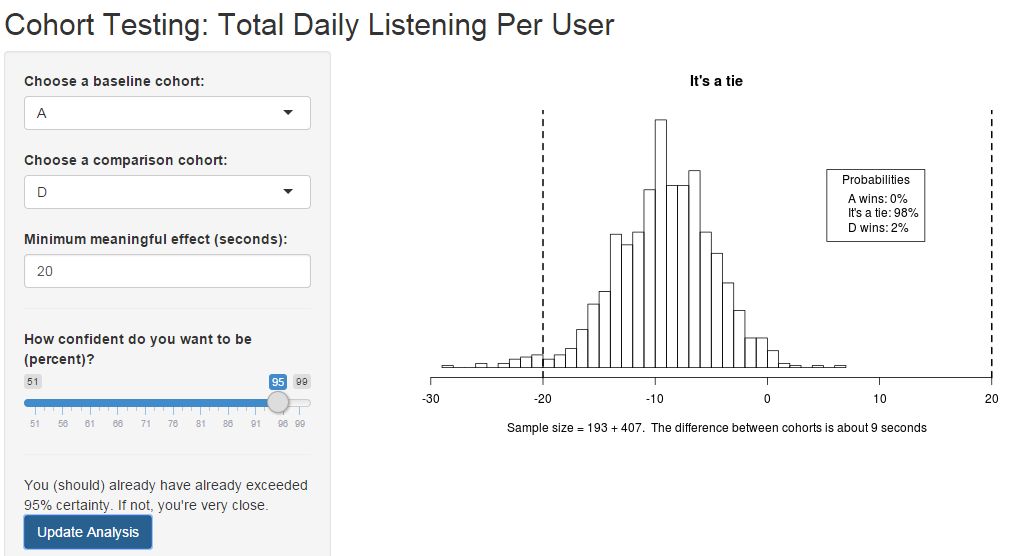
Here’s an example. Recently I was testing the hypothesis that version B of an app improved daily listening times over version A of the same app. Daily listening times for this app are around 40 minutes and cost difference for implementing B over A is small, so our product owner and I decided that any change less than 30 seconds was not meaningful. This left me with three hypotheses to test:
- Listening times for B are more than 30 seconds longer per day than for A (B wins).
- Listening times for A are more than 30 seconds longer per day than for B (A wins).
- Listening times for B and A are within 30 seconds of each other (tie).
I can test all of these hypotheses with standard hypothesis tests. If none are true, I can assume the mean difference in times is correct (it is our best estimate of the mean, given the data) and do a power calculation (although this is not the standard calculation, it’s pretty straightforward) to tell how much more data I need.
All three questions answered.
I implemented this in R using the ‘shiny‘ package to make it an interactive Web-based tool. A live demo is here and sample code is here on Github. You’ll need a server with shiny-server installed to use and test it or you can run it on ShinyApps.io (like my demo). I found it trivial to install on my Ubuntu server which I run at work for internal use.
