

"Our net promoter score for the new version is 42."
Okay. So what? Is 42 good or bad? Should we continue rolling out the new version, or should we roll back to the previous version?
"The previous version had an NPS of 35."
Ah, some context! It looks like the new version is an improvement.
Wait, are we sure?
"We surveyed 10 people."
Hmm. That would be a no.
When you report a number, provide a quantitative context.
Usually this means:
- Comparison: A second number (or more) that the audience is familiar with and to which they can compare the first number.
- Precision: Is there uncertainty about the numbers? How much?
- Significance: A sense of how much weight they should put on the difference between the two numbers when making a decision.
Note that precision is not the same as significance.
- Precision: Literally, think of this as the number of decimal places. Ways to describe this include statistical significance, standard errors, frequentist confidence intervals, Bayesian credible intervals, bootstrapped intervals, hypothesis tests, prediction intervals, or just a count of data points.
- Significance: Literally, is this difference important? This is not the same as statistical significance! This is a business determination, not a measurement.
Let's look at a simple example.

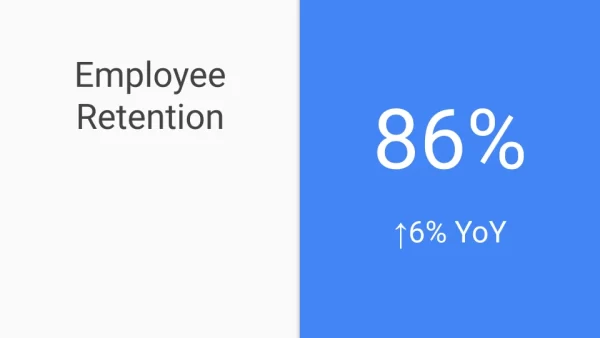
Is 86% good or bad? Does this mean our retention efforts are working? We could add a comparison number explicitly by saying the industry average is Y% or last year we had 80%. A good choice is the percent difference with a familiar value, like last year's retention.
This is better. Now we know that retention went up. Or did it? How precise are these numbers? One way to convey this would be to give a confidence or prediction interval, but these are not based on samples, so there is no sampling uncertainty. A sufficient way to convey precision is to say how many employees there are.
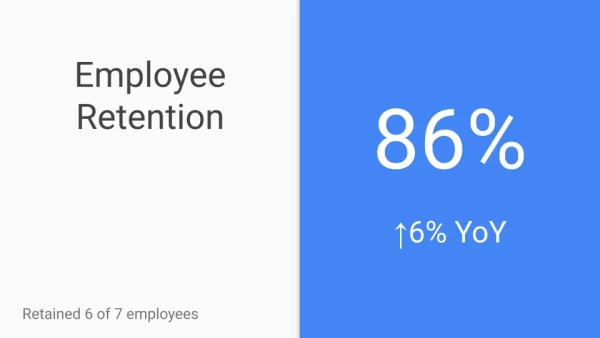
In this scenario, we retained 6/7 employees this year and 4/5 last year. Attrition was one person each year. There's no real change, so let's say so by stating the substantive significance.

This is good. We present the retention, a comparison, a sense of the precision, and the significance.
Now, suppose we had the same retention rate and percent change, but a lot more employees.
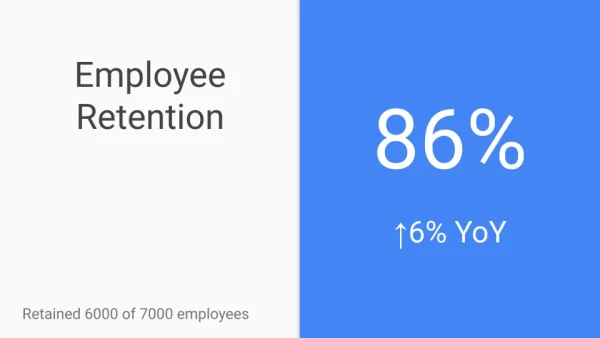
We lost 1000 employees, but the long-term average tenure is 7 years per employee, just like the previous scenario, and it went up by two years (long-term average). We have a lot more data, so we are more precise: the 6% increase is not a quirk in the data. This is good news -- we should make sure the audience knows that.

Note that the number we're reporting (86%) is the same for the two scenarios, but the takeaway is very different because of the context.